CS(顧客満足度)に関する調査・コンサルティングの国際的な専門機関である JD Power(本社:米国ミシガン州トロイ)は、現地時間6月 13日に、JD Power 2023 U.S. Auto Insurance StudySM(JD パワー 2023 年米国自動車保険顧客満足度調査SM)の結果を発表した。
本調査はカリフォルニア州、中央部、フロリダ州、大西洋側中部、ニューイングランド地方、ニューヨーク州、中央北部、北西部、南東部、南西部、テキサス州の 11 エリアに分け、自動車保険の満足度を聴取している。本年調査では「UBI(利用ベース保険)部門」が新設された。
保険料を抑えるため、UBIへの加入率が過去最高を記録
米国の自動車保険加入者の約3分の1(31%)が、過去1年間に保険料が引き上げられたと回答した。これは、自動車保険会社が過去最高の損害率への対応策として、業界平均で15.5%*1の保険料の引き上げを行ったからである。自動車保険会社は、過去20年以上で最悪の業績となる、保険料1ドルあたり平均12セントの損失を2022年に計上し、顧客満足度を犠牲にして保険料を引き上げるほかなかった。本年調査によると、自動車保険に対する満足度は前年比で-12ポイント(1,000ポイント満点)低下し、過去20年間で最大の低下となった。これは、「保険料」ファクターの満足度が前年比で-25ポイントも低下したことに起因する。
この現象は、テレマティクスデータを使用しドライバーの運転に応じて保険料を算定するUBIプログラムへの加入を増加させている。保険会社を初めて利用する顧客のUBI加入率は26%と高い。
*1 米労働統計局:消費者物価指数(CPI)2023年4月
2023年調査の主なポイントは以下の通り:
保険料の高騰により顧客満足度が下落
自動車保険料の上昇率は、消費者物価指数における他のカテゴリーよりも3倍高い(平均+4.9%に対し、自動車保険料は+15.5%)。本年の自動車保険業界全体の総合満足度は822ポイントで、前年の834ポイントから-12ポイントの低下となった。これは、保険料の価格に対する総合満足度が-25ポイント低下したことに起因している。
保険料引き上げを経験した顧客は実際には報告以上の可能性
実際にはより多くの顧客が保険料の引き上げを経験しているはずであるが、そのことを認識しているかどうかは請求書や支払いの方法・頻度によって左右される。
郵送で請求書を受け取りクレジットカードで一括払いをした顧客の半数近く(45%)が保険料の引き上げを経験したと回答したのに対し、デジタル請求書を受け取り自動継続分割払いした顧客では、28%に止まった。
保険料引き上げによりネガティブな反応を示した顧客層
保険料引き上げに対してよりネガティブな反応を示したのは、賃貸住宅に居住する顧客、住宅保険と自動車保険をセットで加入していない顧客、単一車両・単身ドライバー世帯の顧客、保険会社の切り替えに前向きな顧客、保険会社に対する信頼感が低い顧客などである。
UBIが記録的な普及を見せる
使用状況に応じた保険料を支払うUBIへの加入は2016年から2倍以上に増加し、現在、自動車保険顧客の17%が利用している。UBI加入者の「保険料」の満足度は、非加入者と比較し、+59ポイント高くなった。
UBIの普及が進むにつれ、課題も発生
過去最多の顧客がUBIに加入しているが、UBIはまだ比較的新しい技術であり、現在利用している顧客の3分の1(33%)は、UBIに加入してから1年に満たない。UBI技術によって収集されるデータの正確性に対する懸念がペインポイントとなっており、収集された情報が「常に正確である」と回答した顧客はわずか38%に過ぎない。
保険料引き上げの打撃を和らげる
保険料引き上げが顧客満足度にとって良いはずはないが、事前に顧客の希望するチャネル(代理店からの電話など)で通知し、理由を明確にするとともに、UBIなどの利用可能なオプションについて説明することで、顧客の受け止め方に大きな違いが生じる。また、引き上げ額も顧客満足度に影響する。引き上げ額が300ドル以上の人と50ドル以下の人では、「保険料」の満足度には137ポイントの差が見られた。
JD パワー インシュアランス・インテリジェンス部門 ディレクター、マーク・ギャレットのコメント
「保険会社と顧客は経済の現状に直面しているため、自動車保険会社に対する今年の総合満足度は急落した。保険会社は、収益性と顧客体験のバランスを取るという点で、窮地に陥っているが、保険料引き上げの悪影響を和らげる方法はいくつかある。UBIという代替案を積極的に顧客に提供する、必要な保険料引き上げを明確に示し説明する、信頼を得るためにブランドとしての約束を一貫して実行する、などである。」
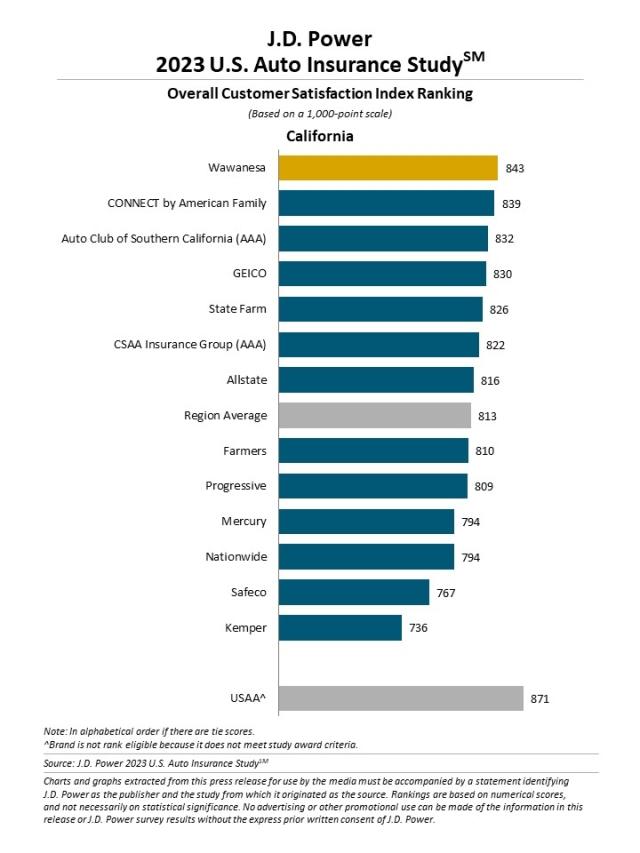
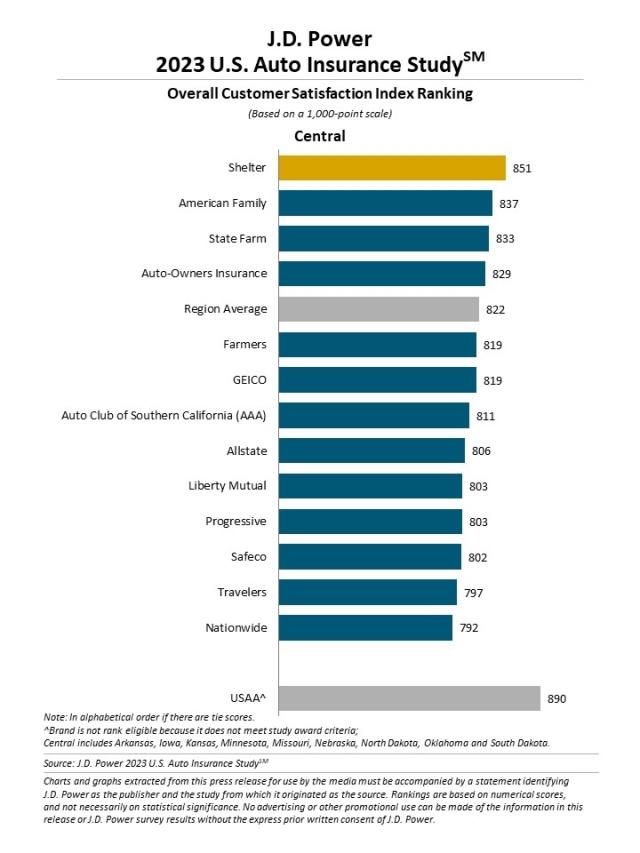
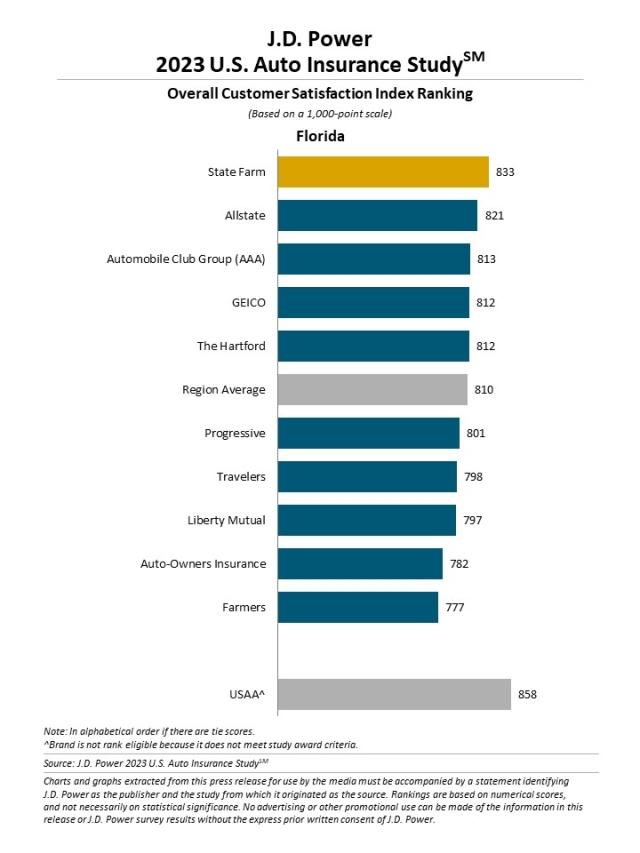
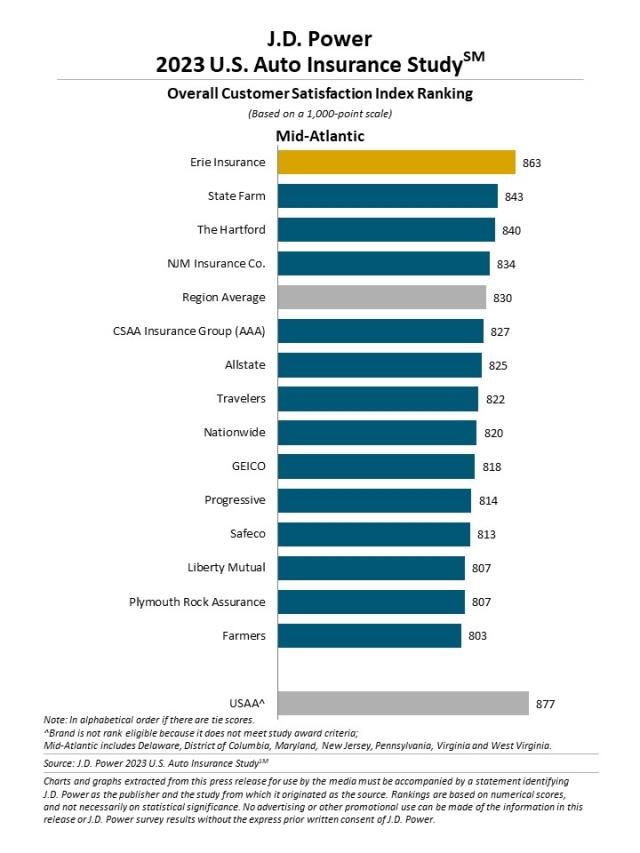
顧客満足度ランキング首位ブランド
【カリフォルニア州】Wawanesa(ワワネサ)(843 ポイント、4年連続の総合満足度第1位)
【中央部】Shelter(シェルター)(851 ポイント、3年連続の総合満足度第1位)
【フロリダ州】State Farm(ステート・ファーム)(833ポイント)
【大西洋側中部】Erie Insurance(エリー)(863 ポイント、2年連続の総合満足度第1位)
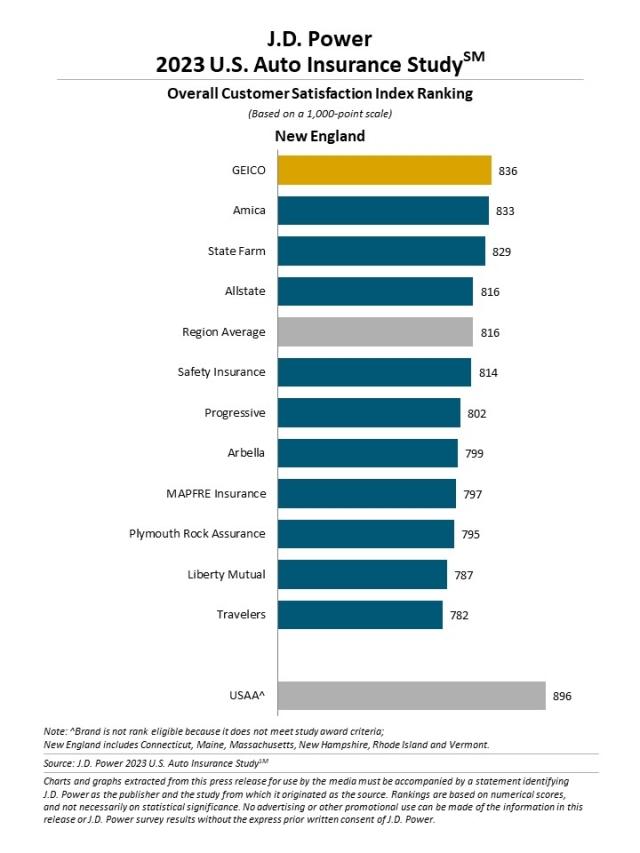
【ニューイングランド地方】GEICO(ガイコ)(836 ポイント)
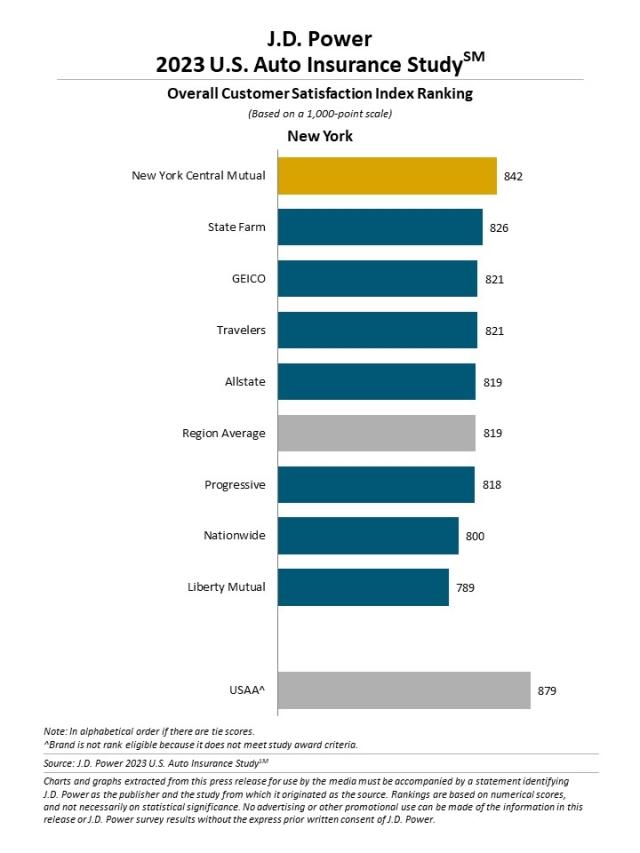
【ニューヨーク州】New York Central Mutual(ニューヨーク・セントラル・ミューチュアル)(842 ポイント、2年連続の総合満足度第1位)
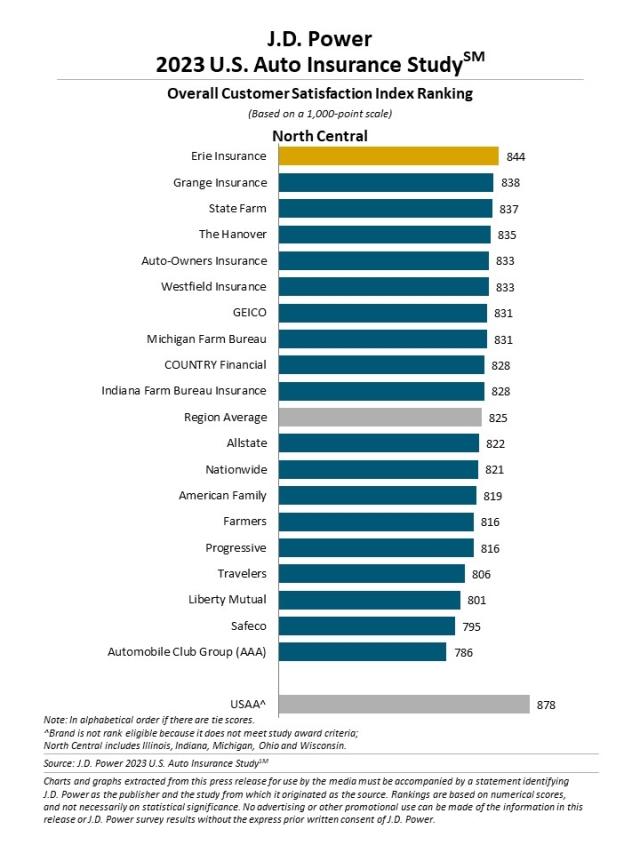
【中央北部】Erie Insurance(エリー)(844 ポイント、3年連続の総合満足度第1位)
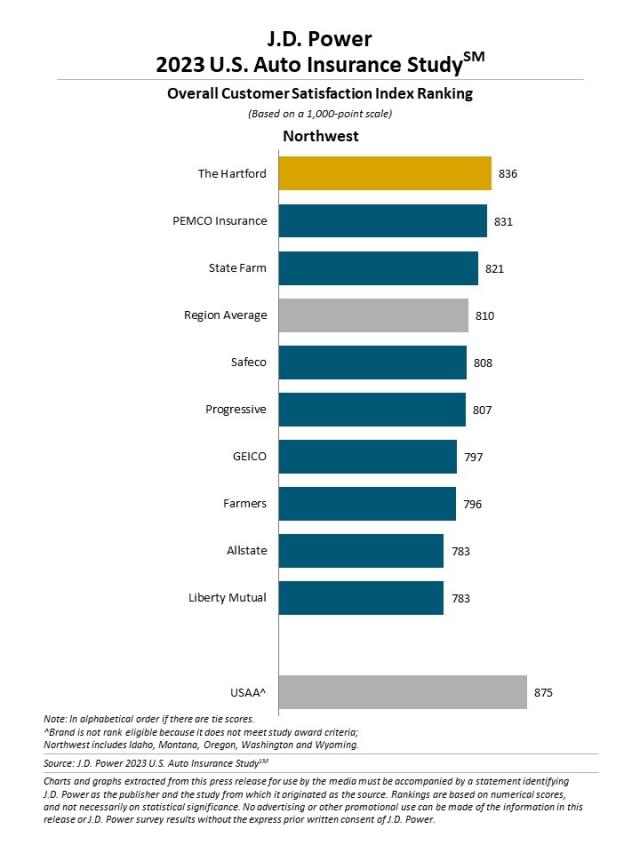
【北西部】The Hartford(ハートフォード)(836 ポイント、2年連続の総合満足度第1位)
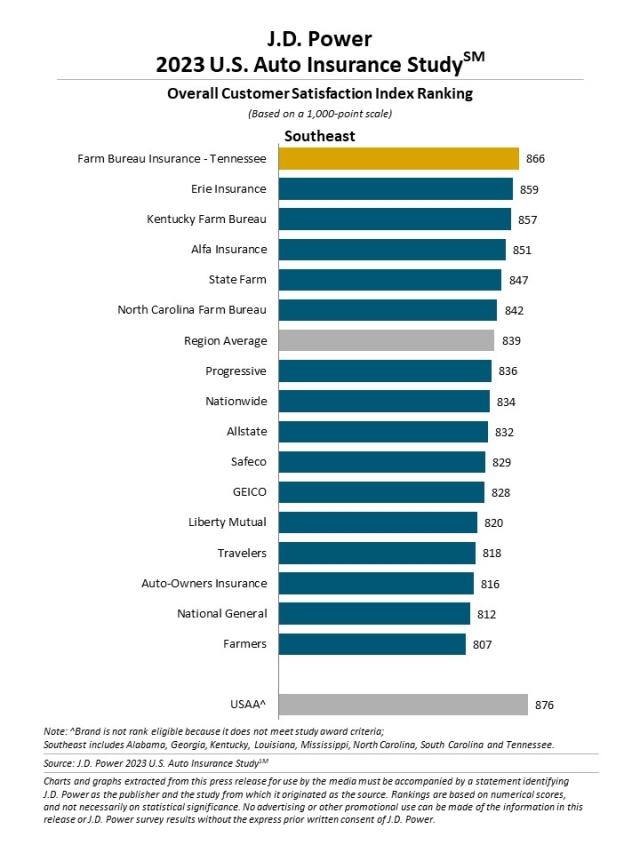
【南東部】Farm Bureau Insurance - Tennessee(テネシー・ファーム・ビューロー)(866 ポイント、12年連続の総合満足度第1位)
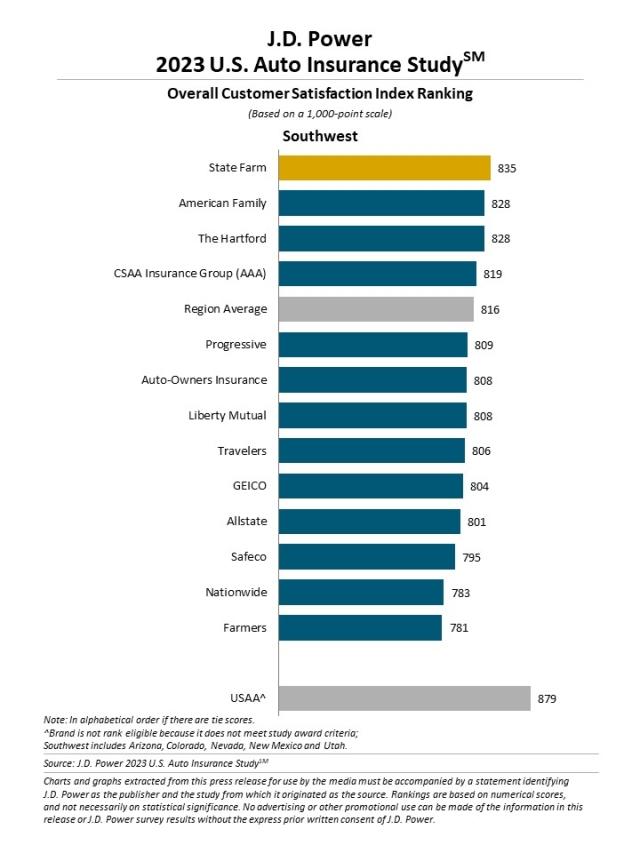
【南西部】State Farm(ステート・ファーム)(835 ポイント、2年連続の総合満足度第1位)
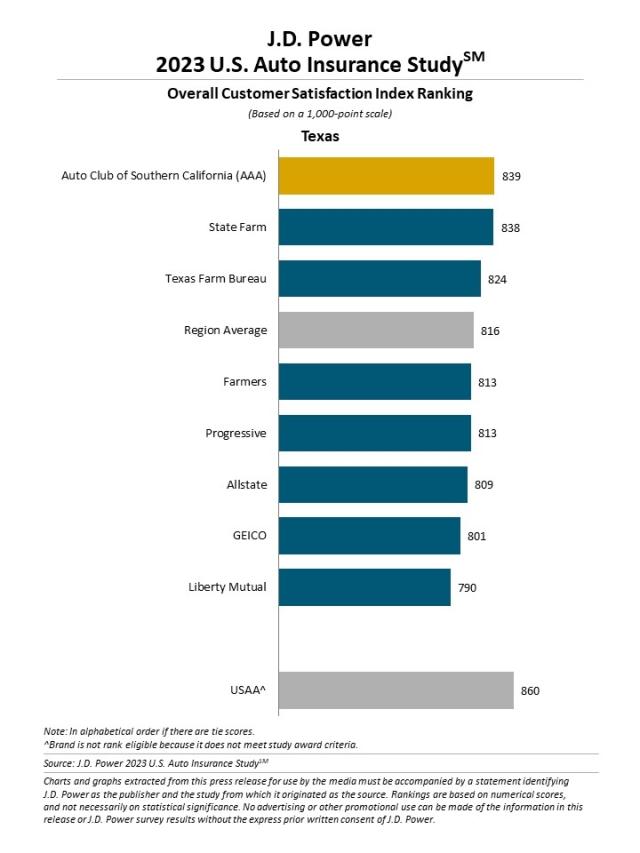
【テキサス州】Auto Club of Southern California(AAA、南カリフォルニア全米自動車協会)(839 ポイント)
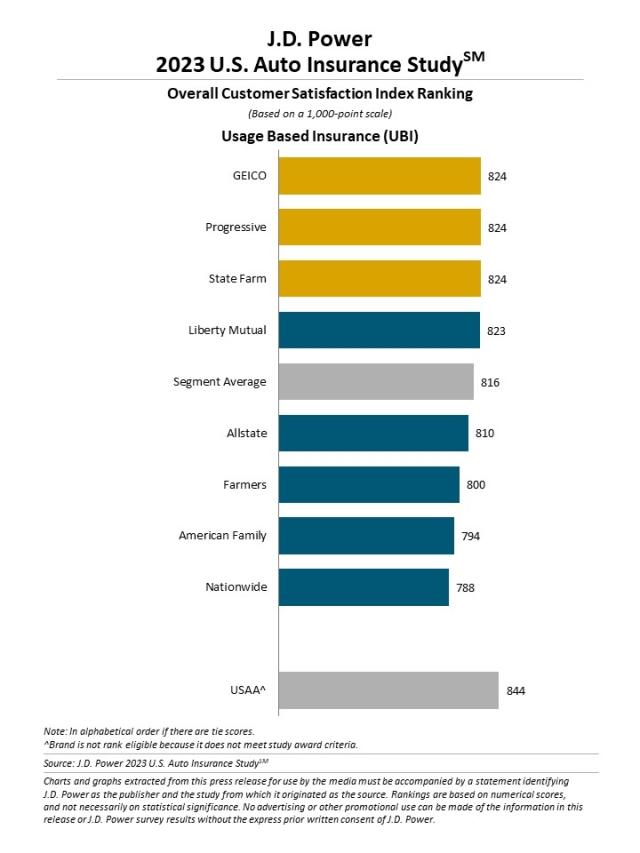
【UBI(利用ベース保険)部門】GEICO(ガイコ)、Progressive(プログレッシブ)、State Farm(ステート・ファーム)(同点、824ポイント)
《JD パワー 2023年米国自動車保険顧客満足度調査SM概要》
年に1回、自動車保険契約者を対象に、契約している自動車保険に対する満足度を聴取し明らかにする調査。
今回で 24 回目の実施となる。本年調査では「UBI(利用ベース保険)部門」が新設された。
■実施期間:2023年1月~4月
■調査方法:インターネット調査
■調査対象:自動車保険契約者
■調査回答者数:41,437人
総合的な顧客満足度に影響を与えるファクターを設定し、各ファクターの詳細評価項目に関するユーザーの評価を基に1,000ポイント満点で総合満足度スコアを算出。総合満足度を構成するファクターは、総合満足度に対する影響度が大きい順に、以下の通り。
【エリア別】:「顧客対応」(27%)、「保険料」(21%)、「契約内容」(21%)、「保険証券・支払方法」(19%)、「保険金支払」(13%)
【UBI(利用ベース保険)部門】:「割引率」(30%)、「アプリ・ウェブサイトの使いやすさ」(24%)、「利用しやすさ」(22%)、「情報の分かりやすさ」(19%)、「初期プロセス」(5%)
*本報道資料は、現地時間 2023年6月13日に米国で発表されたリリースを要約したものです。
原文リリースはこちら
https://www.jdpower.com/business/press-releases/2023-us-auto-insurance-study
*JD パワーが調査結果を公表する全ての調査は、JD パワーが第三者機関として自主企画し実施したものです。
【ご注意】本紙は報道用資料です。弊社の許可なく本資料に掲載されている情報や結果を広告や販促活動に転用することを禁じます。
JD パワーについて:
JD パワー(本社:米国ミシガン州トロイ)は消費者インサイト、アドバイザリーサービス、データ分析における国際的なマーケティングリサーチカンパニーです。50年以上にわたり、ビッグデータやAI、アルゴリズムモデリング機能を駆使し、消費者行動を捉え、世界を牽引する企業に、ブランドや製品との顧客の相互作用に関する鋭い業界インテリジェンスを提供するパイオニアです。
JD パワーは、北米、ヨーロッパ、アジア太平洋にオフィスを構えています。事業内容の詳細については、https://japan.jdpower.com/jaをご覧ください。